My Library
Here are the books I’ve acquired over the last two years. After dabbling from 2012 to 2013, I started buying books. Many of the ones toward the end of the list you may find hardly worth your time. The web design, Java, and other similar books were typically obtained because they were free or inexpensive and I needed some quick solutions. I plan to update this library, web content, and I’ll add key manuscripts as time goes by. Also, I’ll fill in key information about each over time, as it allows.
Data Science:
‘What is Data Science’ by Mike Loukides
- A free Kindle book that gives a very brief, high level description of data science, for the person who knows nothing about data science.
- ‘Data science enables the creation of data products.’
- ‘“big data” is when the size of the data itself becomes part of the problem.’
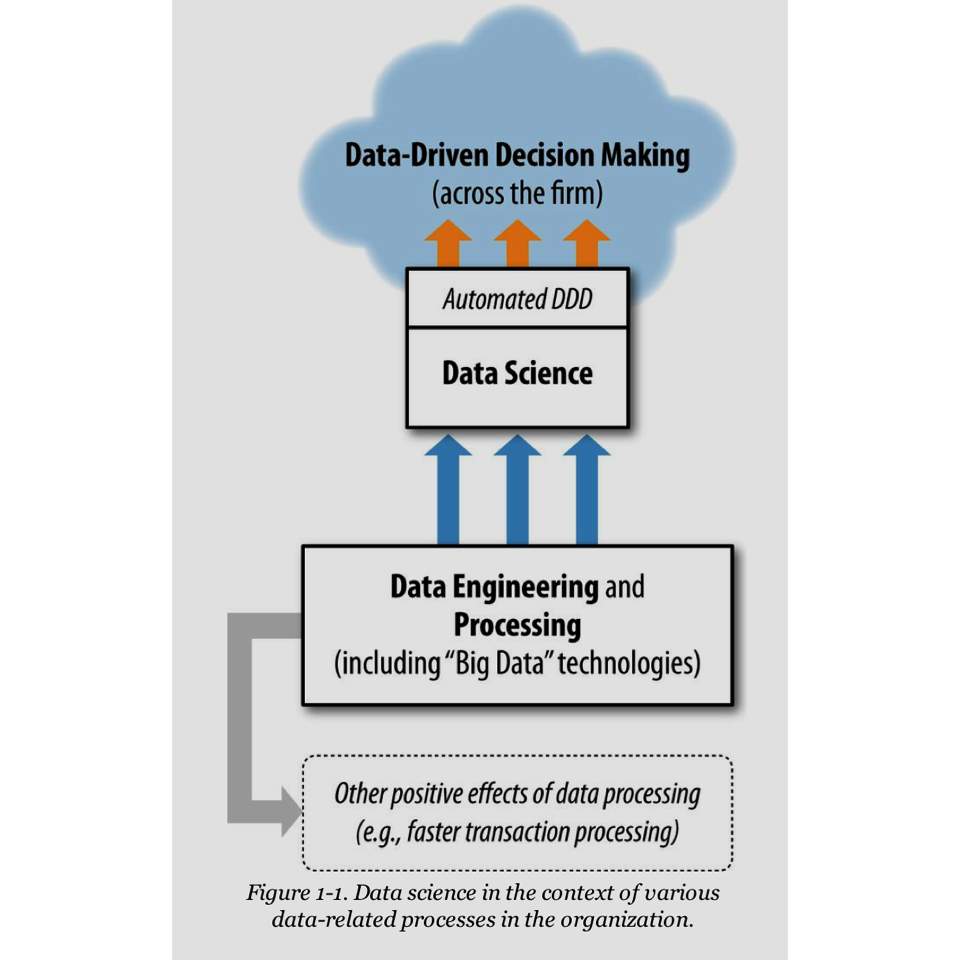
‘Data Science for Business’ by Foster Provost & Tom Fawcett is a deep dive into the fundamentals of data mining and data-analytic thinking. This book focuses on the science and not the technology.
- In this figure they describe ’Data-driven decision-making (DDD) refers to the practice of basing decisions on the analysis of data, rather than purely on intuition. Although, I would argue for Data-informed.
Fundamental Concepts:
- ‘..the fundamental principles of data science: data, and the capability to extract usefull knowledge from data, should be regarded as key strategic assets.’
- ‘if a consultant presents a proposal to mine a data asset to improve your business, you should be able to assess whether the proposal makes sense.’
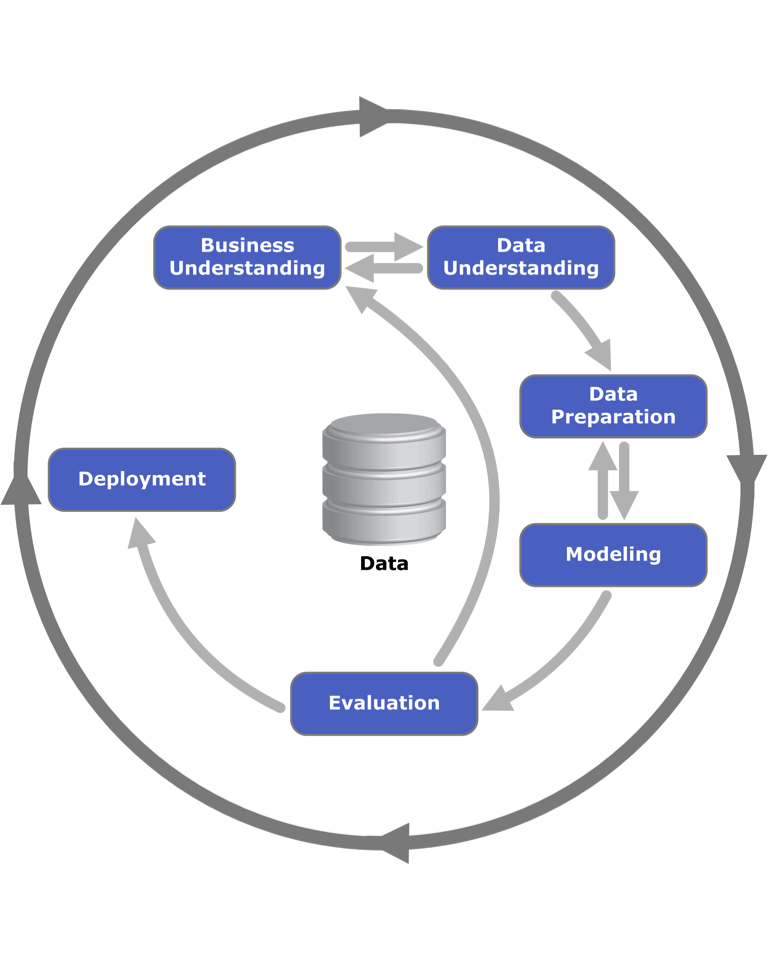
- ‘Extracting useful knowledge from data to solve business problems can be treated systematically by following a process with reasonably well-defined stages.’ See CRISP-DM – a Standard Methodology to Ensure a Good Outcome.
- ‘From a large mass of data, information technology can be used to find informative descriptive attributes of entities of interest.’
- ‘If you look too hard at a set of data, you will find something — but it might not generalize beyond the data you’re looking at. This is referred to as overfitting a dataset.’
- ‘Formulating data mining solutions and evaluating the results involves thinking carefully about the context in which they will be used.’
‘R for Marketing Research and Analytics’ by Chris Chapman and Elea McDonnell Feit’ is a book introduces R, fundamentals of data analysis, and advanced marketing applications. This is a very important book for me.
Why R?
- ‘For analysts, R offers the largest and most diverse set of analytic tools and statistical methods.’
- ‘It is the platform of choice for the largest number of statisticians who create new analytics methods, so emerging techniques are often available first in R.’
When R?
- ‘You want access to methods that are newer or more powerful than available elsewhere.’
- ‘You need to run an analysis many, many times…R is perfect for model iteration.’
- ‘You need to apply an analysis to multiple data sets. Because everything is scripted, R is great for analyses that are repeated across data sets. It even has tools available for automated reporting.’
- ‘You need to develop a new analytic technique or wish to have perfect control and insight into an existing method.’
A Few Key Points of Fundamentals of Data Analysis:
- ‘Consider simulating data before collecting it, in order to test your assumptions and develop initial analysis code. Always check structure, data quality, and plot data for inspection.’
- ‘Before modeling, it is important to check the data quality and the distribution of values on each variable.’
- ‘To interpret coefficients on a standardized scale, such that they are comparable to one another, you will either need predictors that are on identical scales or that have been standardized to be on a uniform scale. The most common standardization is conversion to units of standard deviation.’
- ‘A linear model assumes that the relationship between predictors and an outcome is linear and that errors in fit are symmetric with similar variability across their range (a property known as homoskedasticity). Results may be misleading when these assumptions do not match the data.’
- ‘An interaction is a predictor that is the product of two other predictors, and thus assesses the degree to which the predictors reinforce (or cancel) one another.’
- ‘Model building is the process of adding and removing predictors from a model to find a set of predictors that fits the data well.’
- ‘We recommend to interpret coefficients in terms of their estimated ranges, such as confidence intervals…or credible intervals form Bayesian estimates’
A Few Key Points of Advanced Marketing Applications:
- ‘Investigation of data complexity has several benefits. It allows inspection of the underlying dimensional relationships among variables, investigation of how observations such as brands or people vary on those dimensions, and estimation of a smaller number of more reliable dimensional scores.’
- ‘…consider three common methods to reduce complexity by reducing the number of dimensions in the data.’
- ‘Principal component analysis (PCA) attempts to find uncorrelated linear dimensions that capture maximal variance in the data.’
- ‘Exploratory factor analysis (EFA) also attempts to capture variance with a small number of dimensions while seeking to make the dimensions interpretable in terms of the original variables.’
- ‘Multidimensional scaling (MDS) maps similarities among observations in terms of a low-dimension space such as a two-dimensional plot. MDS can work with metric data and with non-metric data such as categorical or ordinal data.’
- ‘Principal component analysis (PCA) attempts to find uncorrelated linear dimensions that capture maximal variance in the data.’
- ‘Colinearity occurs when two or more variables are highly associated. Including them in a linear model can result in confusing, nonsensical, or misleading results, because the model cannot differentiate the contribution from each of them.’
- ‘Logistic regression relates a binary outcome such as purchase to predictors that may include continuous and factor variables, by modeling the variables’ association with the probability of the outcome.’
- ‘a hierarchical model estimates both group level effects and individual differences in effects. Such models are popular in marketing because they provide insight into differences among customers (heterogeneity) and distribution of preference. HLM are exemplified when we estimate the importance of effects for individuals as well as for an overall population.’
- ‘Hierarchical models in marketing are often estimated with Bayesian methods that are able to pool information and produce best estimates of both group and individual effects using potentially sparse data.’
- ‘A structural equation model (SEM) relates observed manifest variables—such as data points or survey responses—to underlying latent variables. It estimates the strength of associations in a proposed model, as well as the degree to which the model fits the observed data.’
- ‘Two general approaches to SEM are the covariance-based approach (CB-SEM), which attempts to model the relationships among the variables at once and thus is a strong test of the model, and’
- ‘the partial least squares approach (PLS-SEM), which fits parts of the data sequentially and has less stringent requirements.’
- ‘The general goal of market segmentation is to find groups of customers that differ in important ways associated with product interest, market participation, or response to marketing efforts. By understanding the differences among groups, a marketer can make better strategic choices about opportunities, product definition, and positioning, and can engage in more effective promotion.’
‘Data Science from Scratch’ by Joel Grus is a book that focuses heavily on the practical application of Python to conduct data science, and its set up to be your first day on the job as a data scientist. I’ve focused so heavily on R-based analytics that I’ve invested little toward Python. However, several key leaders in the field suggest that Python may overcome many other preferred tools in the future. I’m keeping a close eye on Python, but for a later time.
Statistics in R:
‘Introductory Statistics with R’ by Peter Dalgaard is an beginner’s book for the statitician using R. It provides introductory principles on using R to conduct probability and distributions, descriptive statistics and graphics, one- and two-sample tests, regression and correlation, ANOVA and Kruskal-Wallis, Tabular data, power and computation of sample size, multiple regression, linear models, logistic regression, and survival analysis.
‘Discovering Statistics Using R’ by is also a beginner’s that assumes the reader knows nothing about statistics. The author provides a little bit of humor, and takes out some of the mystery between various tests by connecting the dots. The sections are also coded with a score ‘1 thru 4’ to reflect the level of difficulty.
‘An Introduction to Statistical Learning’ by Gereth James, et al. is a very important book on modeling and understanding complex datasets through a blend of statistics, computer science, and machine learning.
- ‘…Statistical learning tools can be classified as supervised or unsupervised…supervised statistical learning involves building a statistical model for predicting, or estimating, an output based on one or more inputs…With unsupervised statistical learning, there are inputs but no supervising output; nevertheless we can learn relationships and structure from such data.’
- ‘Predicting a qualitative response for an observation can be referred to as classifying that observation, since it involves assigning the observation to a category, or class.’
- ‘Resampling methods are an indispensable tool in modern statistics. They involve repeatedly drawing samples from a training set and refitting a model of interest on each sample in order to obtain additional information about the fitted model.’
- ’In the regression setting, the standard linear model $ Y=B0 + B1X1 + … + BpXp + e $ is commonly used to describe the relationship between a response Y and a set of variables $ X1, X2,…,Xp $.
‘Statistical Models: Theory and Practice’ by David Freedman is a textbook that focus on application of linear models, including generalized least squares, probits, and logits. It also explains the use of bootstrap to estimate bias and computing standard errprs. It is designed for advanced undergraduates or beginning graduate students in statistics.
‘Statistical Models’ by A.C. Davison is a book intended as an integrated modern account of statistical models covering the core topics for studies up to a masters degree in statistics.
Machine Learning in R:
Applied Predictive Modeling is an essential book on data analysis with a specific focus on the practice of predictive modeling.
Other R Resources:


Practical Text Mining by Gary Milner et al.
## Warning in readPNG("/Users/jdstallings/Google Drive/Blog/dataindeed/static/
## images/Text_Analysis.png"): libpng warning: iCCP: known incorrect sRGB
## profile
Other: